Objective: To analyze preoperative risk factors for complications following radical esophageal cancer surgery, and to establish a preoperative risk prediction model for postoperative complications, thereby providing a reference for medical staff to formulate and implement reasonable intervention measures for patients. Methods: Clinical data from 485 patients who underwent surgery for esophageal cancer were retrospectively collected and randomly divided into a training set (340 cases) and a validation set (145 cases) at a ratio of 7: 3. Independent predictors were identified by univariate logistic regression, LASSO regression, and multivariate logistic regression analysis, and a nomogram model was constructed. The model's discriminative ability, calibration, and clinical utility were evaluated using ROC curves, calibration curves, DCA curves, and CIC curves. Results: The incidence of postoperative complications in this study was 36.9%. The proportions of various complication types were: pleural effusion 49.2%, aspiration pneumonia 7.3%, pulmonary infection 40.2%, pneumothorax 16.8%, atelectasis 2.8%, and respiratory failure 2.8%. Five predictors—age, BMI, underlying lung disease, NRS 2002 score, and tumor location—were included in the final model. The AUCs of the training set and validation set were 0.777 (95% CI: 0.725–0.829) and 0.702 (95% CI: 0.609–0.790), respectively, indicating good calibration and clinical practicability. Conclusion: The preoperative risk prediction model established in this study demonstrates good discrimination, calibration, and clinical effectiveness.
This is an Open Access article, distributed under the terms of the Creative Commons Attribution 4.0 International License (http://creativecommons.org/licenses/by/4.0/), which permits unrestricted use, distribution and reproduction in any medium or format, provided the original work is properly cited.
Esophageal Cancer, Postoperative Complications, Risk Factors, Risk Prediction Model
1. Introduction
Esophageal cancer ranks as one of the most prevalent malignancies within the digestive tract and constitutes the seventh leading cause of cancer-related mortality globally
[1]
Bray F, Laversanne M, Sung H, et al. Global cancer statistics 2022: GLOBOCAN estimates of incidence and mortality worldwide for 36 cancers in 185 countries. CA Cancer J Clin. 2024; 74(3): 229-263.
. Notably, China exhibits the highest incidence of esophageal cancer, contributing to 43.9% of the global incidence and 42.1% of the mortality associated with this disease. Surgical intervention remains the primary curative strategy
[2]
Dhungel B, Diggs BS, Hunter JG, Sheppard BC, Vetto JT, Dolan JP. Patient and Peri-operative Predictors of Morbidity and Mortality After Esophagectomy: American College of Surgeons National Surgical Quality Improvement Program (ACS-NSQIP), 2005–2008. J Gastrointest Surg. 2010; 14(10): 1492-1501.
, however, the unique anatomical positioning and intricate surgical techniques render esophageal cancer resection a high-risk procedure. Approximately 10–50% of patients experience postoperative complications
[3]
Law S, Wong KH, Kwok KF, Chu KM, Wong J. Predictive factors for postoperative pulmonary complications and mortality after esophagectomy for cancer. Ann Surg. 2004; 240(5): 791-800.
Kooij CD, De Jongh C, Kingma BF, et al. The Current State of Robot-Assisted Minimally Invasive Esophagectomy (RAMIE): Outcomes from the Upper GI International Robotic Association (UGIRA) Esophageal Registry. Ann SurgOncol. 2025; 32(2): 823-833.
Chevallay M, Jung M, Chon SH, Takeda FR, Akiyama J, Mönig S. Esophageal cancer surgery: review of complications and their management. Annals of the New York Academy of Sciences. 2020; 1482(1): 146-162.
, which are linked to various preoperative risk factors
[2]
Dhungel B, Diggs BS, Hunter JG, Sheppard BC, Vetto JT, Dolan JP. Patient and Peri-operative Predictors of Morbidity and Mortality After Esophagectomy: American College of Surgeons National Surgical Quality Improvement Program (ACS-NSQIP), 2005–2008. J Gastrointest Surg. 2010; 14(10): 1492-1501.
Cheng Z, Johar A, Gottlieb-Vedi E, Nilsson M, Lagergren J, Lagergren P. Impact of co-morbidity on reoperation or death within 90 days of surgery for oesophageal cancer. BJS Open. 2021; 5(1): zraa035.
Ohi M, Toiyama Y, Omura Y, et al. Risk factors and measures of pulmonary complications after thoracoscopic esophagectomy for esophageal cancer. Surg Today. 2019; 49(2): 176-186.
. These complications often result in prolonged hospitalizations, higher readmission rates, increased healthcare costs, increased risk of recurrence, reduced survival rates, and a diminished quality of life. In severe instances, they may pose life-threatening consequences
[10]
27th annual conference of the international society for quality of life research. Qual Life Res. 2020; 29(S1): 1-196.
. Therefore, preoperative risk prediction is essential to assist surgeons in accurately selecting patients and to help patients make informed decisions
[11]
Winter A, Van De Water RP, Pfitzner B, et al. Enhancing preoperative outcome prediction: A comparative retrospective case–control study on machine learning versus the international esodata study group risk model for predicting 90-day mortality in oncologic esophagectomy. Cancers. 2024; 16(17): 3000.
. However, existing foreign forecasting models, such as Ferguson et al.
[12]
Ferguson MK, Durkin AE. Preoperative prediction of the risk of pulmonary complications after esophagectomy for cancer. J ThoracCardiovasc Surg. 2002; 123(4): 661-669.
, have limited predictive power in the Chinese population
[13]
Xing X zhong, Gao Y, Wang H jun, et al. Assessment of a predictive score for pulmonary complications in cancer patients after esophagectomy. World J Emerg Med. 2016; 7(1): 44-50.
, and there is still a lack of targeted preoperative risk prediction models in China. Therefore, based on the outcomes of postoperative complications, this study aims to develop a risk prediction model with improved predictive efficacy and enhanced clinical practicality, making it more applicable to the Chinese population. This model can provide a basis for the subsequent development of clinical decision support systems, assist medical staff in identifying high-risk patients early, implement targeted interventions, reduce the incidence of postoperative complications, and promote postoperative rehabilitation.
2. Materials and Methods
2.1. Clinical Data
Patients who underwent radical resection for esophageal cancer at Shaanxi Provincial People's Hospital from January 2014 to October 2024 were selected to collect preoperative data: age, sex, BMI, smoking history, previous medical history (underlying lung disease, hypertension, diabetes, heart disease, etc.), ASA grade, pathological type, tumor location, TNM stage, degree of differentiation, cardiac ejection fraction (EF), FEV1/FVC, white blood cell count, NLR, creatinine, NRS 2002 score, hypoproteinemia, PNI, and anemia. This study was approved by the Medical Ethics Committee of our hospital (SPPH-LLBG-34-4.0).
Inclusion criteria: age ≥18 years; patients diagnosed with esophageal cancer clinically, radiologically, and pathologically according to the 2022 edition of the Chinese Guidelines for Diagnosis and Treatment of Esophageal Cancer; patients undergoing radical surgery for esophageal cancer in our hospital after diagnosis; clinical case data were basically complete.
Exclusion criteria: patients who died within 24 hours after surgery; patients who were readmitted to the hospital; patients with seriously incomplete data.
2.2. Methods
According to a ratio of 7: 3, the data were randomly divided into a training set and a validation set. Using R software, we performed univariate logistic regression, LASSO regression, and multivariate logistic regression analyses on the training set data, step by step, to screen for independent risk factors, fit the model, and construct a nomogram. The discrimination, calibration, and clinical validity of the model were evaluated and validated using both sets of data.
3. Results
3.1. Variable Selection Results
3.1.1. Results of Univariate Logistic Regression Analysis
Comparing the patient information of the training set and the verification set, the incidence of postoperative complications in the training set was 37.4%, while in the verification set it was 35.9%. The distribution of outcome events in the two data sets was basically consistent. None of the variables were statistically significant in the training and validation sets (P > 0.05), indicating that the two datasets were highly comparable in terms of patient baseline characteristics.
The data from the training set were divided into two groups: the complication group and the non-complication group, and univariate logistic regression analysis was performed. The results showed (Table 1) that there were differences in age, BMI, smoking history, underlying lung diseases, NRS 2002 score, hypoproteinemia, and tumor location between the two groups (P < 0.05).
Table 1. Univariate logistic regression analysis of patients undergoing surgery for esophageal cancer.
Variable
Comparison group
OR (95%CI)
P-value
Age
1.062 (1.033, 1.094)
< 0.001
Sex
Female vs. Male
0.941 (0.538, 1.619)
0.829
BMI
0.753 (0.668, 0.846)
< 0.001
Smoking history
Yes vs. No
1.647 (1.017, 2.709)
0.046
ASA classification
Below level III vs. Above level III
0.648 (0.340, 1.242)
0.186
Underlying lung disease
Yes vs. No
4.229 (2.419, 7.561)
< 0.001
Diabetes
Yes vs. No
0.887 (0.348, 2.107)
0.792
High blood pressure
Yes vs. No
1.600 (0.907, 2.810)
0.102
Heart disease
Yes vs. No
1.660 (0.990, 2.778)
0.054
NRS 2002 rating
≥3 points vs. < 3 points
10.941 (5.151, 26.127)
< 0.001
Hypoproteinemia
Yes vs. No
1.915 (1.111, 3.304)
0.002
PNI
0.967 (0.930, 1.005)
0.091
Anaemia
Yes vs. No
0.521 (0.234, 1.072)
0.090
EF
0.963 (0.914, 1.013)
0.148
FEV1/FVC
0.246 (0.045, 1.270)
0.098
WBC
1.047 (0.974, 1.126)
0.208
NLR
1.027 (0.999, 1.061)
0.076
Creatinine
0.988 (0.974, 1.001)
0.087
Pathological type
0.492
Adenocarcinoma vs. Squamous cell carcinoma
1.250 (0.403, 3.680)
0.686
Other vs. Squamous cell carcinoma
0.333 (0.017, 2.099)
0.319
Tumor location
< 0.001
Neck and upper thoracic segment vs. Middle thoracic segment
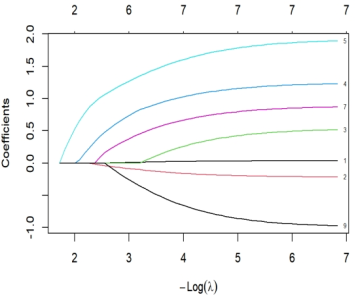
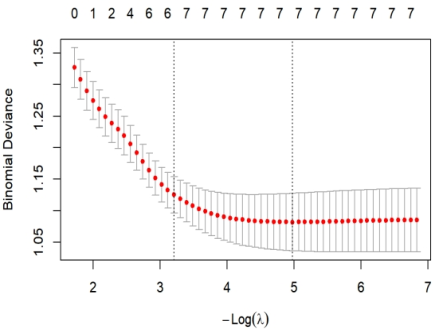
To mitigate the risk of model overfitting, LASSO regression was applied to the independent variables identified as statistically significant (P < 0.05) in the univariate logistic regression analysis. In the coefficient path plot (Figure 1), each curve traces the evolution of an individual variable’s regression coefficient as the regularization parameter λ varies (from high to low values). As λ decreases, the penalty weakens, allowing coefficients of additional variables to transition from zero to non-zero. The vertical axis represents the estimated regression coefficients. Furthermore, guided by 10-fold cross-validation results (Figure 2), the optimal λ value was selected as λ.1se = 0.04040307(the largest λ within one standard error of the minimum cross-validation error), ensuring a balance between model parsimony and predictive performance. This threshold yielded the six core predictors retained.
3.1.3. Multivariate Logistic Regression Analysis
Multivariate logistic regression analysis was performed on the above variables, and the results showed (Table 2) that age, BMI, underlying lung diseases, NRS 2002 score, and tumor location were independent risk factors for postoperative pulmonary complications of esophageal cancer (P < 0.05).
Table 2. Multivariate logistic regression analysis of patients undergoing surgery for esophageal cancer.
Variable
β
SE.
OR (95% CI)
P-value
Constant
0.710
1.843
0.305 (0.004, 21.805)
0.700
Age
0.037
0.017
1.037 (1.003, 1.073)
0.034
BMI
-0.212
0.071
0.809 (0.702, 0.928)
0.003
Smoking history
0.498
0.299
1.645 (0.923, 2.989)
0.096
Underlying lung disease
1.246
0.334
3.477 (1.819, 6.784)
< 0.001
NRS 2002 score ≥3
1.954
0.465
7.059 (2.957, 18.668)
< 0.001
Neck and upper thoracic tumors
0.817
0.326
1.367 (0.639, 2.915)
0.012
Lower thoracic tumor
-0.931
0.354
0.394 (0.192, 0.773)
0.009
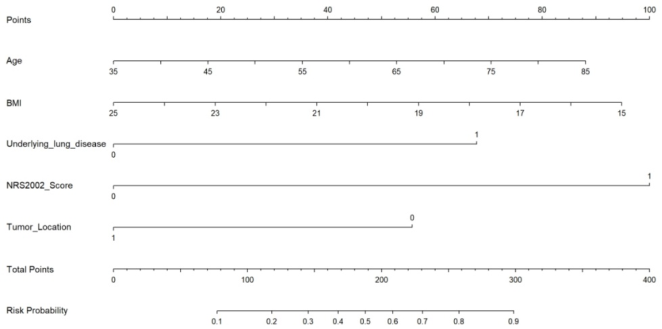
3.2. Nomogram Prediction Model
Based on the results of multivariate logistic regression analysis, a prediction model was fitted, and a nomogram map was drawn to visualize the model (Figure 3). The regression coefficient of each variable was converted into an intuitive score of 0-100 points in proportion, and the predicted probability of postoperative complications of the patient could be intuitively obtained by adding the corresponding scores of each index of the patient, finding the corresponding positions on the total score axis, and making a vertical line with the risk axis. The assignment of each variable is shown in Table 3.
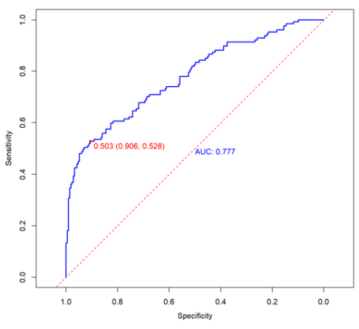
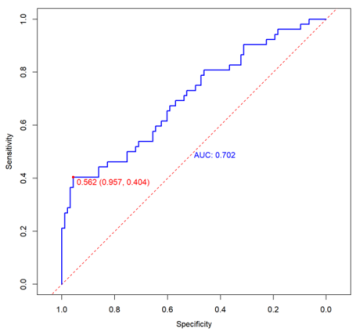
The receiver operating characteristic (ROC) curve was drawn, and the differentiation of the prediction model was evaluated by the area under the curve (AUC) (Figure 4 and Figure 5). The AUC of the training set and the validation set were 0.777 (95%CI: 0.725-0.829) and 0.702 (95%CI: 0.609-0.790), respectively. The optimum cutoff value of the model on the training set is 0.503, and the corresponding sensitivity and specificity are 90.6% and 52.8%, respectively; the best cutoff value on the verification set is 0.562, and the corresponding sensitivity and specificity are 95.7% and 40.4%, respectively.
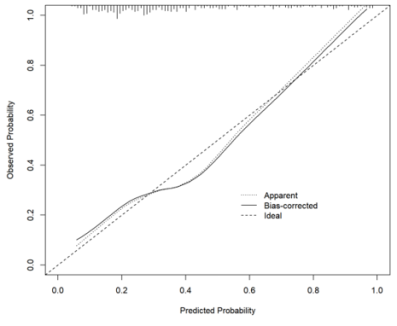
In the training set (Figure 6), the apparent calibration curve deviated slightly from the bias-corrected curve. Specifically, the apparent curve fell marginally below the ideal diagonal line in the intermediate probability range, suggesting a tendency toward overestimation. After applying Bootstrap resampling (1,000 iterations), the bias-corrected curve aligned more closely with the ideal line, indicating improved calibration performance following correction.
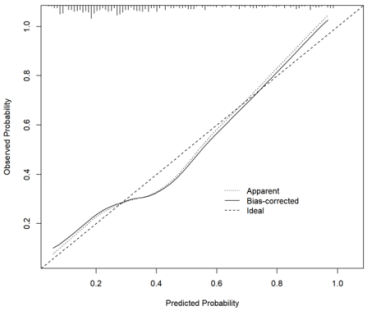
In the validation set (Figure 7), the overall pattern of the calibration curve closely resembled that of the bias-corrected curve from the training set, exhibiting a "U-shaped" calibration pattern. This consistency suggests that the model's calibration generalizes reasonably well to new data. However, the deviation from the ideal line was slightly more pronounced in the validation set than in the training set's corrected curve, implying that the calibration accuracy on new data could be further enhanced.
The Hosmer-Lemeshow test yielded non-significant results in both the training set (P = 0.414) and the validation set (P = 0.635), indicating no substantial discrepancy between predicted and observed probabilities and supporting good model fit.
In summary, the model demonstrates satisfactory calibration in the training set with a low risk of overfitting.
3.3.3. Decision Curve and Clinical Impact Curve Analyses
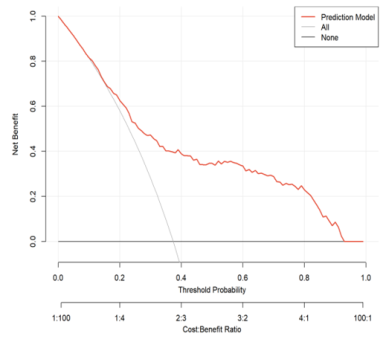
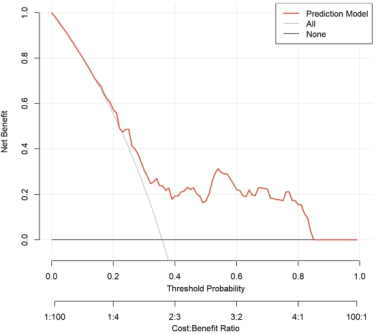
In the training set (Figure 8), the net benefit curve of the model consistently exceeded that of both the “All” and “None” reference strategies across a wide range of threshold probabilities. This finding suggests that using the model to guide clinical decisions would yield a superior net benefit within this interval. In the validation set (Figure 10), the net benefit curve exhibited a trend similar to that observed in the training set, maintaining a favorable net benefit over a broad range of thresholds. These results indicate that the model retains satisfactory clinical utility and decision-making value in the validation cohort.
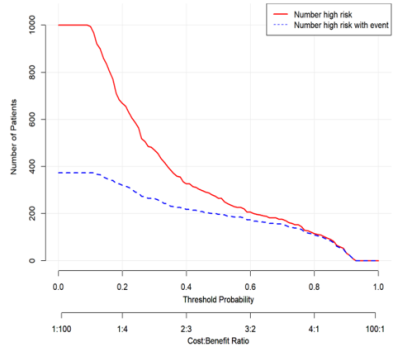
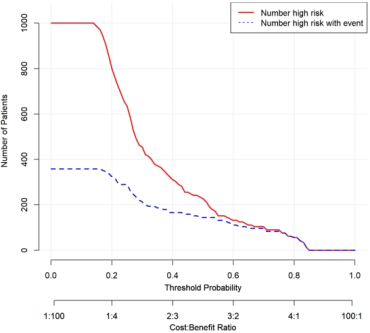
In the training set (Figure 9), at a risk threshold of 0.5, the model predicted that approximately 280 individuals would experience the outcome, whereas the actual number of individuals with the outcome was approximately 200. For thresholds exceeding 0.5, the model's predictions closely aligned with the observed outcomes, indicating high clinical prediction efficiency. The curve derived from the validation set (Figure 11) demonstrated a high degree of consistency with that of the training set, further confirming the model's reliable risk identification capacity and clinical utility.
4.1. Preoperative Risk Factors for Complications After Radical Esophagectomy
A total of 485 patients were included in this study. The overall incidence of postoperative complications was 36.9%, which is comparable to rates reported in previous studies
[4]
Kooij CD, De Jongh C, Kingma BF, et al. The Current State of Robot-Assisted Minimally Invasive Esophagectomy (RAMIE): Outcomes from the Upper GI International Robotic Association (UGIRA) Esophageal Registry. Ann SurgOncol. 2025; 32(2): 823-833.
Chevallay M, Jung M, Chon SH, Takeda FR, Akiyama J, Mönig S. Esophageal cancer surgery: review of complications and their management. Annals of the New York Academy of Sciences. 2020; 1482(1): 146-162.
. Multivariate logistic regression analysis revealed that age, BMI, underlying pulmonary disease, NRS 2002 score, and tumor location were independent risk factors for postoperative complications. Among these, an NRS 2002 score ≥ 3 emerged as the strongest predictor, with a significantly higher risk compared to those with a score < 3 (OR = 7.059, 95% CI: 2.957–18.668, P < 0.001). This finding underscores the critical role of preoperative nutritional status in postoperative recovery.
4.2. Analysis of Risk Prediction Model for Complications After Radical Esophagectomy
Postoperative complications following radical esophagectomy remain a significant concern due to their high incidence and adverse impact on patient prognosis. Although several models for predicting postoperative complications have been reported, their applicability to the Chinese population is limited. For example, the model by Ferguson et al.
[12]
Ferguson MK, Durkin AE. Preoperative prediction of the risk of pulmonary complications after esophagectomy for cancer. J ThoracCardiovasc Surg. 2002; 123(4): 661-669.
showed modest predictive accuracy (AUC = 0.539) and relied heavily on static indicators like preoperative pulmonary function. However, our model achieved superior discriminative ability. Specifically, it exhibited good discrimination, with an AUC of 0.777 in the training set and 0.702 in the validation set. Calibration was also adequate, as indicated by a non-significant Hosmer-Lemeshow test (P = 0.635) in the validation set. Furthermore, decision curve analysis revealed that the model provided a greater net benefit across a wide range of threshold probabilities compared to the default strategies, underscoring its potential clinical utility. These findings suggest that the model is not only statistically robust but also holds promise for clinical application, enabling clinicians to accurately identify high-risk patients who require intensified management while minimizing unnecessary interventions for low-risk individuals.
4.3. Limitations and Future Prospects
This study and its model have certain limitations. As a single-center retrospective study, it is subject to potential selection bias. Future research could address these limitations in the following three aspects. First, expanding the sample size through multi-center studies that include patients from hospitals across different regions and various tiers of healthcare facilities would enhance generalizability. Additionally, incorporating key intraoperative and postoperative variables could further optimize the model. Second, based on the optimized model, user-friendly clinical decision support tools (e.g., mobile applications) could be developed to facilitate its convenient application in clinical practice. Third, prospective interventional studies are warranted to determine whether preoperative management guided by this model can effectively reduce the incidence of postoperative complications and improve patient prognosis.
5. Conclusion
To sum up, the risk prediction model constructed in this study has good differentiation, calibration and clinical effectiveness, but it is still necessary to conduct large-scale, multi-center prospective studies in the future, verify the model with independent external data, and calibrate the model again.
Abbreviations
BMI
Body Mass Index
ASA
American Society of Anesthesiologists
EF
Cardiac Ejection Fraction
FEV1/FVC
Forced Expiratory Volume in the First Second / Forced Vital Capacity
NLR
Neutrophil-to-Lymphocyte Ratio
PNI
Prognostic Nutritional Index
ROC
Receiver Operating Characteristic Curve
DCA
Decision Curve Analysis
CIC
Clinical Impact Curve
Acknowledgments
We sincerely thank Shaanxi Provincial People's Hospital for providing the valuable data support platform and the Hospital Medical Ethics Committee for its approval. Thanks to Wu Hongjuan, Fu Jia and Ma Tian for completing the research method design and solving difficult problems under the framework of the project, and providing vital help and support in the key links such as statistical analysis and paper revision.
Author Contributions
Jiao Hao: Data curation, Investigation, Validation, Visualization, Writing – original draft, Writing – review & editing
Tian Ma: Data curation, Investigation, Resources, Software
Funding
This study was supported by the Medical Research Project of Xi 'an Science and Technology Bureau (No.: 2024JH-YLYB-0076): Construction and application of clinical decision support system for preoperative preparation management of patients with esophageal cancer. It was conducted in collaboration with the project “Development and Empirical Study of a Quality Evaluation Index System for Preoperative Preparation Management in Esophageal Cancer Patients,” supported by the Shaanxi Provincial People’s Hospital.
Conflicts of Interest
The authors declare no conflicts of interest.
References
[1]
Bray F, Laversanne M, Sung H, et al. Global cancer statistics 2022: GLOBOCAN estimates of incidence and mortality worldwide for 36 cancers in 185 countries. CA Cancer J Clin. 2024; 74(3): 229-263.
Dhungel B, Diggs BS, Hunter JG, Sheppard BC, Vetto JT, Dolan JP. Patient and Peri-operative Predictors of Morbidity and Mortality After Esophagectomy: American College of Surgeons National Surgical Quality Improvement Program (ACS-NSQIP), 2005–2008. J Gastrointest Surg. 2010; 14(10): 1492-1501.
Law S, Wong KH, Kwok KF, Chu KM, Wong J. Predictive factors for postoperative pulmonary complications and mortality after esophagectomy for cancer. Ann Surg. 2004; 240(5): 791-800.
Kooij CD, De Jongh C, Kingma BF, et al. The Current State of Robot-Assisted Minimally Invasive Esophagectomy (RAMIE): Outcomes from the Upper GI International Robotic Association (UGIRA) Esophageal Registry. Ann SurgOncol. 2025; 32(2): 823-833.
Chevallay M, Jung M, Chon SH, Takeda FR, Akiyama J, Mönig S. Esophageal cancer surgery: review of complications and their management. Annals of the New York Academy of Sciences. 2020; 1482(1): 146-162.
Cheng Z, Johar A, Gottlieb-Vedi E, Nilsson M, Lagergren J, Lagergren P. Impact of co-morbidity on reoperation or death within 90 days of surgery for oesophageal cancer. BJS Open. 2021; 5(1): zraa035.
Ohi M, Toiyama Y, Omura Y, et al. Risk factors and measures of pulmonary complications after thoracoscopic esophagectomy for esophageal cancer. Surg Today. 2019; 49(2): 176-186.
Winter A, Van De Water RP, Pfitzner B, et al. Enhancing preoperative outcome prediction: A comparative retrospective case–control study on machine learning versus the international esodata study group risk model for predicting 90-day mortality in oncologic esophagectomy. Cancers. 2024; 16(17): 3000.
Ferguson MK, Durkin AE. Preoperative prediction of the risk of pulmonary complications after esophagectomy for cancer. J ThoracCardiovasc Surg. 2002; 123(4): 661-669.
Xing X zhong, Gao Y, Wang H jun, et al. Assessment of a predictive score for pulmonary complications in cancer patients after esophagectomy. World J Emerg Med. 2016; 7(1): 44-50.
Hao, J., Wu, H., Fu, J., Ma, T. (2026). A Preoperative Risk Prediction Model for Complications After Radical Resection of Esophageal Cancer. American Journal of Nursing and Health Sciences, 7(1), 1-11. https://doi.org/10.11648/j.ajnhs.20260701.11
Hao, J.; Wu, H.; Fu, J.; Ma, T. A Preoperative Risk Prediction Model for Complications After Radical Resection of Esophageal Cancer. Am. J. Nurs. Health Sci.2026, 7(1), 1-11. doi: 10.11648/j.ajnhs.20260701.11
Hao J, Wu H, Fu J, Ma T. A Preoperative Risk Prediction Model for Complications After Radical Resection of Esophageal Cancer. Am J Nurs Health Sci. 2026;7(1):1-11. doi: 10.11648/j.ajnhs.20260701.11
@article{10.11648/j.ajnhs.20260701.11,
  author = {Jiao Hao and Hongjuan Wu and Jia Fu and Tian Ma},
  title = {A Preoperative Risk Prediction Model for Complications After Radical Resection of Esophageal Cancer},
  journal = {American Journal of Nursing and Health Sciences},
  volume = {7},
  number = {1},
  pages = {1-11},
  doi = {10.11648/j.ajnhs.20260701.11},
  url = {https://doi.org/10.11648/j.ajnhs.20260701.11},
  eprint = {https://article.sciencepublishinggroup.com/pdf/10.11648.j.ajnhs.20260701.11},
  abstract = {Objective: To analyze preoperative risk factors for complications following radical esophageal cancer surgery, and to establish a preoperative risk prediction model for postoperative complications, thereby providing a reference for medical staff to formulate and implement reasonable intervention measures for patients. Methods: Clinical data from 485 patients who underwent surgery for esophageal cancer were retrospectively collected and randomly divided into a training set (340 cases) and a validation set (145 cases) at a ratio of 7: 3. Independent predictors were identified by univariate logistic regression, LASSO regression, and multivariate logistic regression analysis, and a nomogram model was constructed. The model's discriminative ability, calibration, and clinical utility were evaluated using ROC curves, calibration curves, DCA curves, and CIC curves. Results: The incidence of postoperative complications in this study was 36.9%. The proportions of various complication types were: pleural effusion 49.2%, aspiration pneumonia 7.3%, pulmonary infection 40.2%, pneumothorax 16.8%, atelectasis 2.8%, and respiratory failure 2.8%. Five predictors—age, BMI, underlying lung disease, NRS 2002 score, and tumor location—were included in the final model. The AUCs of the training set and validation set were 0.777 (95% CI: 0.725–0.829) and 0.702 (95% CI: 0.609–0.790), respectively, indicating good calibration and clinical practicability. Conclusion: The preoperative risk prediction model established in this study demonstrates good discrimination, calibration, and clinical effectiveness.},
 year = {2026}
}
TY  - JOUR
T1  - A Preoperative Risk Prediction Model for Complications After Radical Resection of Esophageal Cancer
AU  - Jiao Hao
AU  - Hongjuan Wu
AU  - Jia Fu
AU  - Tian Ma
Y1  - 2026/03/28
PY  - 2026
N1  - https://doi.org/10.11648/j.ajnhs.20260701.11
DO  - 10.11648/j.ajnhs.20260701.11
T2  - American Journal of Nursing and Health Sciences
JF  - American Journal of Nursing and Health Sciences
JO  - American Journal of Nursing and Health Sciences
SP  - 1
EP  - 11
PB  - Science Publishing Group
SN  - 2994-7227
UR  - https://doi.org/10.11648/j.ajnhs.20260701.11
AB  - Objective: To analyze preoperative risk factors for complications following radical esophageal cancer surgery, and to establish a preoperative risk prediction model for postoperative complications, thereby providing a reference for medical staff to formulate and implement reasonable intervention measures for patients. Methods: Clinical data from 485 patients who underwent surgery for esophageal cancer were retrospectively collected and randomly divided into a training set (340 cases) and a validation set (145 cases) at a ratio of 7: 3. Independent predictors were identified by univariate logistic regression, LASSO regression, and multivariate logistic regression analysis, and a nomogram model was constructed. The model's discriminative ability, calibration, and clinical utility were evaluated using ROC curves, calibration curves, DCA curves, and CIC curves. Results: The incidence of postoperative complications in this study was 36.9%. The proportions of various complication types were: pleural effusion 49.2%, aspiration pneumonia 7.3%, pulmonary infection 40.2%, pneumothorax 16.8%, atelectasis 2.8%, and respiratory failure 2.8%. Five predictors—age, BMI, underlying lung disease, NRS 2002 score, and tumor location—were included in the final model. The AUCs of the training set and validation set were 0.777 (95% CI: 0.725–0.829) and 0.702 (95% CI: 0.609–0.790), respectively, indicating good calibration and clinical practicability. Conclusion: The preoperative risk prediction model established in this study demonstrates good discrimination, calibration, and clinical effectiveness.
VL  - 7
IS  - 1
ER  -